Editors Note – this article was originally posted March 1 and the market has moved slightly forward since that date. If you are interested in the data used in the computations for this article, you may request a client gateway here. Additionally, inventory statistics that auto-update every 30-45 days, may be found here…
 Earlier today, Scott Garnett (Associate Broker and one of One South’s ‘Original 5’) called me and asked my opinion on the pricing of a home his client had made an offer on. The home was purchased in the spring of 2006 and was located in the Near West End. The home had not sold in 2 weeks it had been on the market and his client’s offer was approximately 95% of the asking price.
He asked the simple question, ‘How are we on pricing now compared to 2006?’
Sometimes the simplest questions are the best questions.
After looking at a few metrics and doing some quick ‘back of napkin’ math, we arrived at the answer of $5/SF less. I found that a bit surprising…so I tested another area and found quite a different answer. It got me thinking that it would be very valuable to know how each individual area had recovered from the roller coaster that 2004-2013 had been. I decided to task myself with figuring it out.
This ‘Back to the Future’ series/study will examine multiple areas of Richmond to see how pricing has rebounded. This methodology of the study is either quite appropriate of hugely flawed depending on how many graduate degrees in statistics you have. I happen to think that while it is a very primitive comparison, it is revealing and will tell an interesting story about the RELATIVE strength of each market. If you really study the Richmond housing market (or any market for that reason) you will know that all segments behave differently based on a set of dynamics unique to each. Suburban housing behaves differently than historic housing than condos than waterfront…and so on.
So here goes with installment number one…
Richmond’s Fan District – Where Are We Now?
I wrote a piece called ‘How Did The Fan District Survive The Bursting Bubble‘ a while back that discussed the market dynamics driving values in the Fan District. As a mature neighborhood with excellent walkability and proximity to entertainment and culture, The Fan is underpinned by more stable inputs (mostly the inability to add NEW inventory easily) than many suburban neighborhoods.
[ For a list of homes for sale in the Fan, click here ]
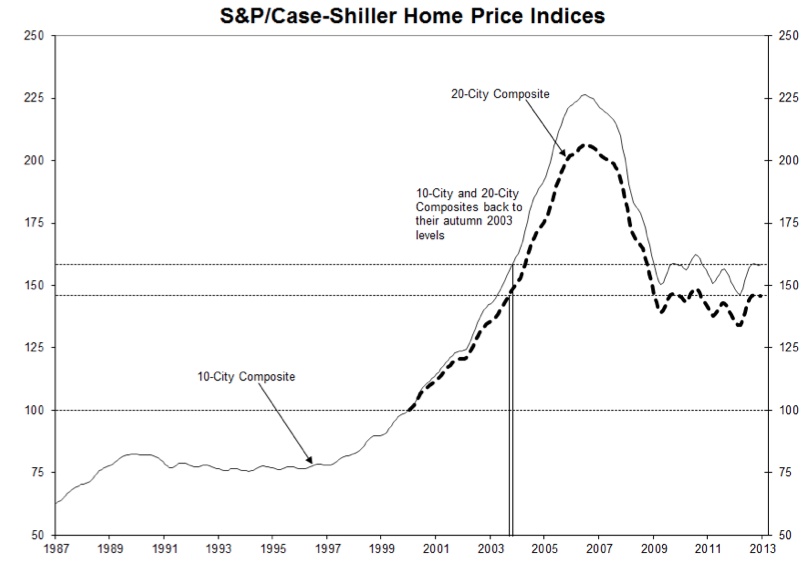
The chart above is the gold standard for home pricing. The Case Shiller Index measures both the Top 10 and Top 20 largest metro markets in the US and tracks both the prices of the homes as well as the appreciation rates in each market. It should be noted that Richmond is NOT one of the cities in the index (the two geographically closest markets that are measured are Washington DC and Charlotte NC, in case you were wondering…) It is also worth noting that the CS Index measures home pricing and not the Price Per SF. When the market soared, many large homes were built that skewed the appreciation and depreciation within each market. Secondarily, some of the largest price increases occurred in markets that became the most overbuilt, also skewing down the average.
While the latest press release from CS shows the national average at a 2003 level, the per foot data of Richmond’s Fan District suggests something different (and by different, I mean BETTER…)
The Fan, as defined by a boundary line drawn down Harrison, Main, Broad and the Boulevard for this exercise, yielded the following ‘Per Square Foot Averages’ by year from 2005-2102:
- 2005 – $170/SF
- 2006 – $185/SF
- 2007 – $194/SF
- 2008 – $186/SF
- 2009 – $171/SF
- 2010 – $178/SF
- 2011 – $172/SF
- 2012 – $180/SF
This would suggest that by the end of 2012, prices in Richmond’s Fan District were approaching the prices we saw between 2005 and 2006. This is 3 years ahead of the national average.
Seriously?
Now get this – tracking the pending inventory from January and February in 2013, there have been 19 properties pend and sell. If a the properties going under contract are selling at 97% of the asking prices (the data suggest is could be closer to 98%), then the average Per Square Foot price in 2013 is $198.85 (using the $205 per foot price x 97% ask/close ratio)… As anyone who has helped a client buy a home in the Fan recently would tell you, the spring of 2013 has felt a lot like 2007 with multiple offer situations common and ‘Days on Market’ well below the Metro average.
Has pricing returned to 2007 levels in the Fan? I am not ready to admit that we are back to the top of the curve in Richmond’s Fan as this is partially…or perhaps largely…driven by lack of inventory but it does warrant discussion when pricing the property for sale.
Overall, the takeaways are as follows:
- Pricing property correctly requires far more analysis than it did previously
- If you bought prior to 2007, you are pretty close to being back where you started
- If you live in the Fan District, you are probably better off than in may other areas of the country
Next up, Midlothian.

Speak Your Mind